|
Peremennye Zvezdy (Variable Stars) 26, No. 8, 2006 Received 20 October; accepted 10 November.
|
Article in PDF |
THE ABSORPTION SPECTRUM VARIABILITY OF T TAURI
N.Z. Ismailov, N.Kh. Guliev, A.A. Alieva
Shamakha Astrophysical Observatory, National Academy
of Sciences of Azerbaijan,
Shamakha, Azerbaijan
E-mail: Box1955n@yahoo.com
| We present the results of our long-term homogeneous spectroscopy of T Tau, the prototype T Tauri star. We demonstrate that the star's absorption spectrum varies in time and is weakly correlated with variations of brightness and emission spectrum. With increasing intensities of emission lines, the veiling of the photospheric absorption decreases. It is suggested that the absorption-spectrum variations are due to variable additional emission superimposed on the photospheric spectrum and that the amount of veiling is inversely correlated with the emission-line strength in the spectrum of the star. |
1. INTRODUCTION
T Tau is the well-known prototype of low-mass pre-main-sequence
(PMS) stars. Ismailov et al. (2006) presented the results of the
analysis of Balmer H![]() -H
-H![]() , H and K CaII, and
other emission lines. We demonstrated that the system's spectral
activity was different at different times, the variations being
possibly of a long-term cyclic character. We also found different
emission-spectrum activity at different levels of brightness.
During the star's brightest state, the emission-line equivalent
widths show variations by a factor of 5 and even more.
, H and K CaII, and
other emission lines. We demonstrated that the system's spectral
activity was different at different times, the variations being
possibly of a long-term cyclic character. We also found different
emission-spectrum activity at different levels of brightness.
During the star's brightest state, the emission-line equivalent
widths show variations by a factor of 5 and even more.
Studies of the absorption spectrum for stars with masses and luminosities as low as for р Tauri stars (TTSs) are of a large interest for our understanding of these stars' atmospheres. It is known that the absorption spectrum of classical T Tauri stars (CTTSs) is deformed by superposition of emission continuum or of linear emission of unknown nature in the visual range, known as "veiling" of the absorption spectrum. It can lead to systematic errors in measurements of equivalent widths, radial velocities, and other parameters of absorption spectral lines. To avoid negative effects of veiling, spectroscopy with a high spectral resolution and a high signal-to-noise ratio is needed. For some spectral lines, a veiling coefficient can be introduced, it permits to take into account the degree of distortion of the absorption spectrum compared to standard stars of the same spectral class (see, for example, Basri and Batalha, 1990).
Different studies (e.g., Basri and Batalha, 1990; Alencar and Batalha, 2002) show that usually the correction to equivalent widths for the veiling factor is within 10% for different CTTSs. Thus, an analysis of time changes in the absorption spectrum can provide information on the character of the additional emission spectrum. In this paper, we present the results of our long-term spectroscopy aimed at the analysis of the absorption spectrum of the star T Tau.
2. OBSERVATIONS AND RESULTS
Our spectra of the star were obtained in the Cassegrain focus of
the Shamakha Observatory's 2 m telescope using the
![]() -prism spectrograph, with a dispersion of 93 Å/mm at
H
-prism spectrograph, with a dispersion of 93 Å/mm at
H![]() . We observed from 1971 till 1979, virtually each year.
We measured the equivalent widths of FeI, TiI, MnI, CaI, and
other absorption spectral lines and determined the spectral types
and luminosity classes according to criteria specially developed
for our equipment (Rustamov, 1987). Table 1 presents night
averages of equivalent widths for different absorption lines in
the spectrum of the star. In total, we used about 200
spectrograms of the star acquired on 46 observing nights.
. We observed from 1971 till 1979, virtually each year.
We measured the equivalent widths of FeI, TiI, MnI, CaI, and
other absorption spectral lines and determined the spectral types
and luminosity classes according to criteria specially developed
for our equipment (Rustamov, 1987). Table 1 presents night
averages of equivalent widths for different absorption lines in
the spectrum of the star. In total, we used about 200
spectrograms of the star acquired on 46 observing nights.
Table 1. Nightly mean equivalent widths of absorption lines of
T Tau
| No. | JD | FeI | FeI | CaI, TiI | FeI | CaI |
| 244... | 4383 Å | 4325 Å | 4291 Å | 4271 Å | 4226 Å | |
| Wλ, Å | ||||||
| 1 | 0989.203 | 3.6 | 2.0 | 2.2 | 2.6 | 2.8 |
| 2 | 0990.543 | 3.3 | 1.8 | 2.0 | 2.4 | 2.7 |
| 3 | 0995.536 | 3.0 | 1.6 | 2.1 | 2.5 | 2.8 |
| 4 | 0998.531 | 2.6 | 2.0 | 2.3 | 2.8 | 3.0 |
| 5 | 1294.246 | 2.8 | 2.1 | 2.8 | 1.9 | 2.5 |
| 6 | 1374.612 | 3.2 | 1.6 | 2.4 | 2.2 | 2.3 |
| 7 | 1669.256 | 3.7 | 1.9 | 1.9 | 1.7 | 2.4 |
| 8 | 2433.288 | 2.4 | 1.3 | 1.4 | 2.0 | 2.3 |
| 9 | 2762.480 | 2.2 | 1.1 | 1.2 | 1.9 | 2.1 |
| 10 | 2772.309 | 3.8 | 1.5 | 3.0 | 3.1 | 3.1 |
| 11 | 2773.356 | 3.1 | 1.7 | 2.7 | 2.8 | 2.8 |
| 12 | 2774.297 | 2.7 | 1.2 | 2.9 | 3.0 | 3.1 |
| 13 | 2796.192 | 2.5 | 1.4 | 2.5 | 2.6 | 2.6 |
| 14 | 2797.276 | 2.4 | 1.6 | 2.6 | 2.4 | 2.7 |
| 15 | 2780.142 | 2.2 | 1.2 | 1.9 | 2.2 | 2.4 |
| 16 | 3162.282 | 2.5 | 1.3 | 2.2 | 2.5 | 2.3 |
| 17 | 3164.271 | 2.3 | 1.1 | 2.0 | 1.8 | 2.0 |
| 18 | 3169.225 | 2.9 | 1.3 | 2.6 | 1.6 | 1.9 |
| 19 | 3170.256 | 2.7 | 1.5 | 2.8 | 1.4 | 2.3 |
| 20 | 3171.232 | 2.9 | 1.7 | 2.9 | 1.8 | 2.6 |
| 21 | 3203.168 | 3.1 | 1.4 | 2.7 | 2.3 | 2.9 |
| 22 | 3482.265 | 3.4 | 1.6 | 2.8 | 2.8 | 3.1 |
| 23 | 3496.234 | 3.5 | 1.8 | 2.5 | 2.6 | 3.4 |
| 24 | 3497.236 | 2.4 | 1.4 | 2.2 | 2.4 | 2.9 |
| 25 | 3498.208 | 2.8 | 1.5 | 2.3 | 2.8 | 2.7 |
| 26 | 3503.291 | 3.2 | 1.7 | 2.5 | 2.6 | 2.9 |
| 27 | 3504.252 | 3.4 | 1.9 | 2.4 | 3.0 | 3.0 |
| 28 | 3506.237 | 3.6 | 2.0 | 2.7 | 2.8 | 3.1 |
| 29 | 3510.259 | 3.8 | 1.8 | 2.9 | 3.2 | 3.0 |
| 30 | 3511.207 | 3.7 | 2.1 | 3.6 | 2.9 | 2.9 |
| 31 | 3512.313 | 3.6 | 2.1 | 3.7 | 3.1 | 3.4 |
| 32 | 3521.314 | 2.8 | 1.5 | 2.8 | 2.5 | 2.7 |
| 33 | 3568.242 | 2.9 | 1.4 | 2.6 | 2.3 | 2.4 |
| 34 | 3858.279 | 2.7 | 1.2 | 2.4 | 2.6 | 2.6 |
| 35 | 3860.275 | 2.5 | 1.4 | 2.2 | 2.4 | 2.8 |
| 36 | 3861.218 | 2.3 | 1.3 | 2.0 | 2.2 | 2.5 |
| 37 | 3863.238 | 2.6 | 1.8 | 2.3 | 2.5 | 2.3 |
| 38 | 3866.380 | 2.8 | 1.6 | 2.7 | 2.4 | 2.6 |
| 39 | 3869.417 | 2.9 | 1.5 | 2.5 | 2.6 | 2.9 |
| 40 | 3887.296 | 2.7 | 1.7 | 2.9 | 2.8 | 2.7 |
| 41 | 3901.211 | 3.3 | 2.0 | 3.3 | 3.0 | 3.1 |
| 42 | 5689.529 | 3.5 | 1.6 | 3.4 | 3.2 | 3.1 |
| 43 | 5691.420 | 2.4 | 1.4 | 1.9 | 1.9 | 2.5 |
| 44 | 5693.448 | 2.7 | 1.9 | 2.2 | 2.1 | 2.4 |
| 45 | 5695.445 | 2.5 | 1.4 | 2.1 | 2.1 | 2.5 |
| 46 | 6108.310 | 2.8 | 1.8 | 2.3 | 2.9 | 3.1 |
To monitor quick variations of the absorption spectrum, time-resolved series of observations were obtained on some nights, spectra taken one after another with exposure times about 25-30 minutes and the total time coverage of 4-10 hours. Table 2 contains the results of our measurements for such series of observations within a night: equivalent widths and central depths of the absorption lines.
Table 2. Parameters of absorption spectral lines (equivalent
widths in Å, residual intensities) of T Tau measured on individual nights
| JD | FeI 4404 | FeI 4383 | FeI 4325 | TiI, CaI | FeI 4271 | FeI 4226 | FeI 4045 | FeI 4005 | ||||||||
| 4291 | ||||||||||||||||
| 244... |
|
|||||||||||||||
| 0989.143 | 2.7 | 0.44 | 3.8 | 0.57 | 1.8 | 0.43 | 1.8 | 0.43 | 2.6 | 0.43 | 2.5 | 0.53 | 1.2 | 0.33 | 0.5 | |
| 0989.158 | 4.1 | 0.61 | 4.1 | 0.61 | 2.3 | 0.47 | 3.0 | 0.55 | 3.2 | 0.54 | 2.7 | 0.57 | 1.6 | 0.34 | 0.4 | |
| 0989.171 | 3.8 | 0.57 | 3.7 | 0.55 | 2.1 | 0.42 | 2.9 | 0.54 | 3.5 | 0.58 | 3.3 | 0.69 | 1.8 | 0.26 | 0.7 | 0.34 |
| 0989.187 | 2.8 | 0.41 | 4.5 | 0.67 | 2.4 | 0.54 | 2.0 | 0.41 | 3.2 | 0.53 | 2.6 | 0.55 | 2.1 | 0.34 | 0.9 | 0.21 |
| 0989.201 | 3.4 | 0.56 | 3.3 | 0.54 | 2.1 | 0.43 | 1.9 | 0.45 | 1.8 | 0.37 | 3.0 | 0.56 | 1.4 | 0.24 | 0.7 | 0.29 |
| 0989.237 | 3.2 | 0.48 | 3.0 | 0.50 | 2.2 | 0.44 | 2.1 | 0.51 | 2.7 | 0.45 | 3.3 | 0.62 | 1.2 | 0.21 | 0.4 | 0.22 |
| 0989.251 | 2.7 | 0.45 | 3.7 | 0.60 | 1.8 | 0.43 | 2.2 | 0.45 | 2.4 | 0.49 | 2.6 | 0.55 | 0.9 | 0.36 | 0.5 | 0.15 |
| 0989.274 | 2.6 | 0.30 | 2.6 | 0.43 | 1.2 | 0.32 | 1.3 | 0.36 | 4.5 | 0.35 | 1.8 | 0.50 | 0.9 | 0.21 | ||
| 2774.156 | 2.6 | 0.31 | 2.8 | 0.35 | 1.0 | 0.28 | 2.0 | 0.33 | 2.2 | 0.38 | 2.7 | 0.48 | 1.1 | 0.45 | 2.2 | 0.43 |
| 2774.180 | 2.4 | 0.45 | 2.2 | 0.34 | 1.5 | 0.31 | 1.7 | 0.32 | 2.6 | 0.45 | 2.7 | 0.38 | 1.9 | 0.75 | 1.8 | 0.52 |
| 2774.203 | 2.8 | 0.38 | 2.4 | 0.36 | 1.4 | 0.33 | 2.7 | 0.42 | 2.4 | 0.41 | 2.8 | 0.63 | 1.5 | 0.51 | 1.6 | |
| 2774.227 | 2.6 | 0.33 | 2.6 | 0.40 | 0.9 | 0.25 | 1.2 | 0.29 | 2.6 | 0.41 | 3.3 | 0.58 | 1.3 | 2.0 | 0.57 | |
| 2774.250 | 2.9 | 0.35 | 1.5 | 0.37 | 1.5 | 0.31 | 1.6 | 0.31 | 2.0 | 0.34 | 2.1 | 0.37 | 1.9 | 0.41 | 0.9 | 0.17 |
| 2774.271 | 2.8 | 0.41 | 1.5 | 0.37 | 1.0 | 0.33 | 1.4 | 0.31 | 1.9 | 0.37 | 2.8 | 0.61 | 1.8 | 0.40 | 0.7 | 0.22 |
| 2774.297 | 2.7 | 0.40 | 2.5 | 0.47 | 1.2 | 0.34 | 1.9 | 0.35 | 1.9 | 0.37 | 1.6 | 0.35 | 0.8 | 0.45 | 1.3 | |
| 2774.320 | 2.3 | 0.34 | 3.0 | 0.52 | 1.3 | 0.35 | 1.9 | 0.31 | 2.2 | 0.37 | 2.4 | 0.53 | 0.9 | 0.33 | 0.8 | 0.23 |
| 2774.344 | 2.7 | 0.40 | 3.1 | 0.48 | 1.1 | 0.31 | 1.2 | 0.29 | 2.7 | 0.38 | 2.5 | 0.55 | 1.1 | 0.35 | 0.9 | 0.24 |
| 2774.367 | 2.6 | 0.44 | 2.6 | 0.43 | 0.6 | 0.21 | 0.9 | 0.24 | 2.1 | 0.31 | 2.3 | 0.50 | 1.0 | 0.28 | 0.3 | |
| 2774.414 | 2.1 | 0.31 | 1.9 | 0.32 | 1.1 | 0.31 | 1.1 | 0.22 | 1.7 | 0.31 | 2.0 | 0.45 | 1.0 | 0.24 | 0.6 | 0.24 |
| 2774.437 | 2.7 | 0.36 | 2.2 | 0.43 | 1.1 | 0.26 | 1.6 | 0.26 | 1.9 | 0.45 | 1.9 | 0.48 | 0.5 | 0.45 | 0.15 | |
| 6108.279 | 1.7 | 0.36 | 2.7 | 0.48 | 1.7 | 0.45 | 1.9 | 0.36 | 2.7 | 0.44 | 2.8 | 0.59 | 1.2 | 0.39 | 0.9 | 0.36 |
| 6108.312 | 2.3 | 0.40 | 3.1 | 0.51 | 2.0 | 0.47 | 2.7 | 0.48 | 3.1 | 0.51 | 3.4 | 0.69 | 1.3 | 0.39 | 0.4 | 0.36 |
| 6108.340 | 2.3 | 0.40 | 2.7 | 0.48 | 1.6 | 0.39 | 2.2 | 0.44 | 2.9 | 0.48 | 3.1 | 0.60 | 1.4 | |||
According to our measurements, the star's spectral type varies within F4-K3, usually G5-K0, and the luminosity class is V.
Figure 1 displays equivalent-width variations for absorption
lines of neutral iron (FeI
![]() 4271, 4143 Å) and
calcium (CaI
4271, 4143 Å) and
calcium (CaI ![]() 4226 Å) on two individual nights in 1971
and 1976. In 1971, the star was rather faint, and the emission
spectrum corresponds to a quiet state (Ismailov et al., 2006). It
appears from Fig. 1 that, during this activity state, the
absorption-line equivalent widths showed insignificant
variations, within errors, on JD 2440989.
4226 Å) on two individual nights in 1971
and 1976. In 1971, the star was rather faint, and the emission
spectrum corresponds to a quiet state (Ismailov et al., 2006). It
appears from Fig. 1 that, during this activity state, the
absorption-line equivalent widths showed insignificant
variations, within errors, on JD 2440989.
The second panel of Fig. 1 presents the results obtained on JD
2442774, when the star was brighter by 0![]() 5 in the
5 in the ![]() band.
Besides, an increase of the equivalent widths of hydrogen as well
as the м and K CaII emission lines was observed (Ismailov et al.,
2006). It can be seen that considerable wave-like rapid
equivalent-width variations of the spectral lines were observed
within several hours.
band.
Besides, an increase of the equivalent widths of hydrogen as well
as the м and K CaII emission lines was observed (Ismailov et al.,
2006). It can be seen that considerable wave-like rapid
equivalent-width variations of the spectral lines were observed
within several hours.
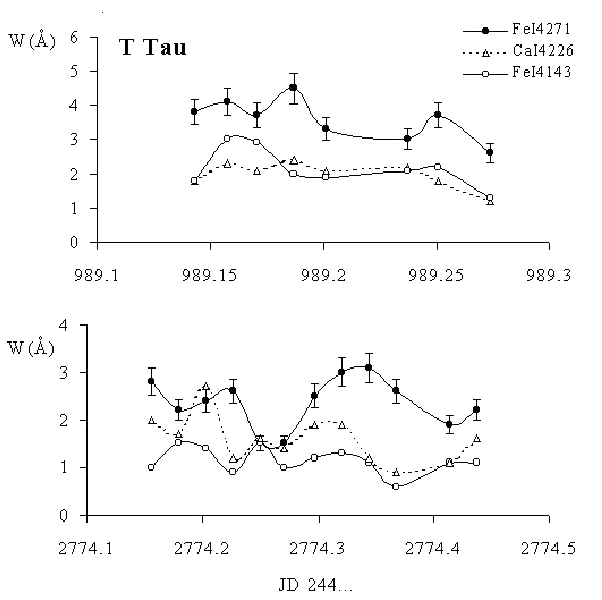 |
Fig. 1.
Variations of the equivalent widths of FeI
|
Figure 2 shows variations of nightly averages of equivalent
widths for some absorption lines in the star's spectrum. All the
diagrams have a characteristic feature: a decrease of the
equivalent width, ![]() , was observed around JD2442000, and
then its value gradually increased. The last panel of Fig. 2
displays variations of the srar's
, was observed around JD2442000, and
then its value gradually increased. The last panel of Fig. 2
displays variations of the srar's ![]() magnitudes for the same
time interval. It clearly appears that a fading was also observed
in the same time interval, with subsequent recovery. Ismailov and
Samus (2003) found the light of T Tau to vary with a 6-year
quasi-period. Later, Melnikov and Grankin (2005) observed new
cycles of the 6-year period, completely confirming this result.
Thus, our spectroscopy covers one 6-year cycle and independently
evidences for the presence of such cycles.
magnitudes for the same
time interval. It clearly appears that a fading was also observed
in the same time interval, with subsequent recovery. Ismailov and
Samus (2003) found the light of T Tau to vary with a 6-year
quasi-period. Later, Melnikov and Grankin (2005) observed new
cycles of the 6-year period, completely confirming this result.
Thus, our spectroscopy covers one 6-year cycle and independently
evidences for the presence of such cycles.
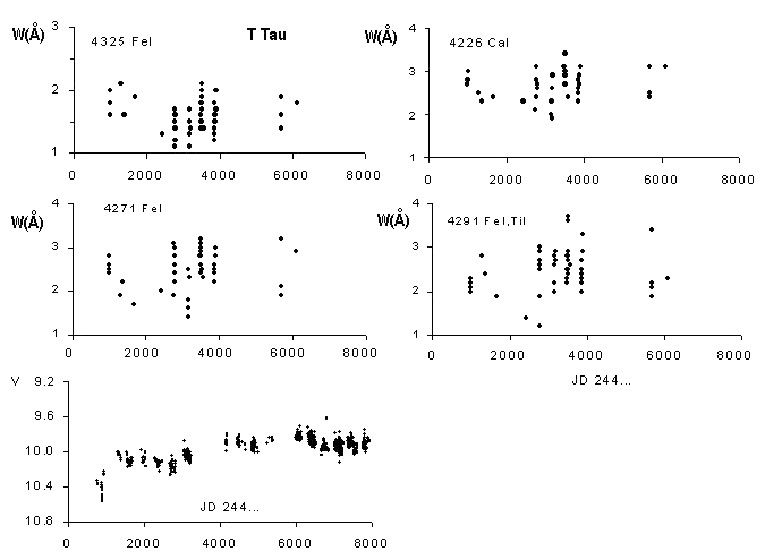 |
Fig. 2.
Variations of night averages of equivalent
widths for FeI
|
To study the correlation of the equivalent widths of the emission
in the hydrogen H![]() , H
, H![]() , H
, H![]() as well as in CaII
м and K lines with equivalent widths of absorption lines in
detail, we introduce a special parameter,
as well as in CaII
м and K lines with equivalent widths of absorption lines in
detail, we introduce a special parameter, ![]() , of the following
sense. We assume that the star's absorption spectrum virtually
does not vary, and the observed absorption-spectrum variations
are due to a superposition of an additional emission of unknown
nature. The spectral type of the star is estimated as G8-K0
(Herbig, 1977; Rustamov, 1999) and as G5-K0 from our data, and
thus we selected a standard K0V star and measured equivalent width
of selected strongest absorption lines in its spectrum obtained
under the same observing conditions. Let the equivalent width of
the standard star's line be
, of the following
sense. We assume that the star's absorption spectrum virtually
does not vary, and the observed absorption-spectrum variations
are due to a superposition of an additional emission of unknown
nature. The spectral type of the star is estimated as G8-K0
(Herbig, 1977; Rustamov, 1999) and as G5-K0 from our data, and
thus we selected a standard K0V star and measured equivalent width
of selected strongest absorption lines in its spectrum obtained
under the same observing conditions. Let the equivalent width of
the standard star's line be ![]() and the equivalent width of the
same line in the
and the equivalent width of the
same line in the ![]() th spectrum of T Tau,
th spectrum of T Tau, ![]() . Then the
parameter
. Then the
parameter
will describe variations of the spectral line's equivalent width in the spectrum of the variable star with respect of the standard star. The parameter's being negative would mean that, because of the superposed additional emission, the photospheric line has a smaller equivalent width than for the standard star. When the parameter approaches positive values, the superposed emission becomes weaker and the lines in the absorption spectrum, "purer". In other words, this parameter measures the additional emission, of unknown nature, contaminating the absorption line.
Figure 3 displays variations of the parameter ![]() versus those of
equivalent widths of the strongest emission lines of hydrogen and
H and K CaII. It permits us to study possible relations between
the emission spectrum and the amount of emission superposed on the
absorption spectrum of the star. It is evident from the diagram
that, virtually in all cases, the following pattern is observed:
larger equivalent widths of hydrogen and CaII emission lines are
met when absorption lines of metals are stronger. However, for
intermediate or small intensities of the emission spectrum, there
is almost no correlation of the emission line widths with the
parameters describing additional emission in absorption lines.
versus those of
equivalent widths of the strongest emission lines of hydrogen and
H and K CaII. It permits us to study possible relations between
the emission spectrum and the amount of emission superposed on the
absorption spectrum of the star. It is evident from the diagram
that, virtually in all cases, the following pattern is observed:
larger equivalent widths of hydrogen and CaII emission lines are
met when absorption lines of metals are stronger. However, for
intermediate or small intensities of the emission spectrum, there
is almost no correlation of the emission line widths with the
parameters describing additional emission in absorption lines.
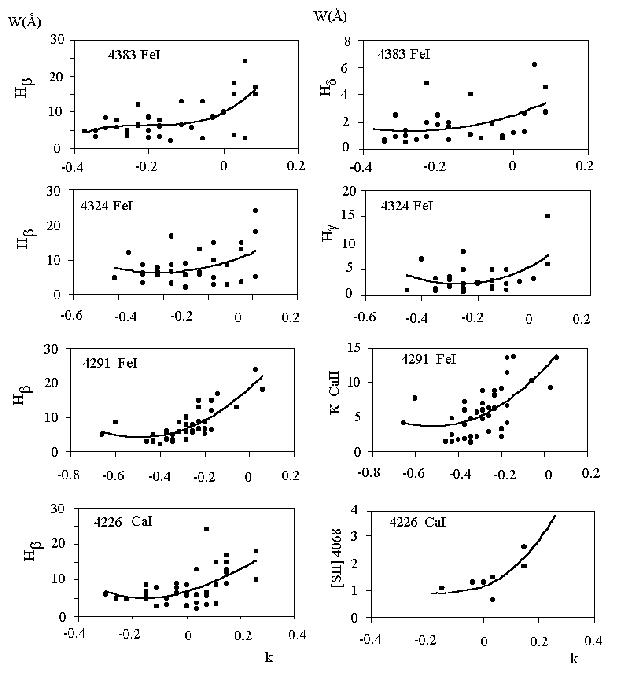 |
Fig. 3.
The relation between the equivalent widths
of hydrogen and H and K CaII emission lines and the parameter |
CONCLUSIONS
As noted above, one of the major problems in studies of CTTSs is veiling of their absorption spectrum with continuous or linear emission. To some extent, this problem has found its solution in the theory of magnetosphere accretion. This theory is able to explain, easily enough, the energy source of powerful emission in hydrogen and H and K CaII lines for TTSs. Besides, it is possible, in a certain approximation, to explain the formation of such high-ionization lines as CIV, NIII, HeII, etc., observed in UV spectra of CTTSs, and to specify the source of additional radiation superposing stellar continuum (see, for example, Lamzin, 1995).
By now, three versions of the magnetosphere-accretion theory for the CTTSs were suggested. The models in Königl (1991), Collier Cameron and Campbell (1993) are based on the pioneer study by Ghosh and Lamb (1979), which deals with accretion on a neutron star and considers only the accretion process. The approach in Shu et al. (1994) differs in that they consider accretion on a star as well as stellar wind governing outer parts of the disk.
An active state of the emission spectrum apparently results from non-stationary accretion of circumstellar matter on a cool star's surface along magnetic tubes, causing strong impact in the accretion zone. During the active state of the emission spectrum, quick variations are observed also in the absorption spectrum. Apparently, the absorption-spectrum variations are virtually directly related to additional emission superposed on the absorption spectrum, this additional emission becoming weaker during active states of the emission spectrum. The reason for such behavior of the absorption and emission spectrum of T Tau is impossible to explain in the frame of the magnetosphere-accretion theory.
We have studied variations of the absorption spectrum of T Tau in 1971-1985. Our analysis of the absorption-line equivalent widths in connection with variations of brightness and emission spectrum leads to the following conclusions.
1. In the quiet emission-spectrum state, the equivalent widths of metal absorption lines show no rapid variations within a night. In such a state, absorption lines vary only from night to night or from season to season.
2. During the active state of the emission spectrum, rapid variations of the star's absorption spectrum, at time scales from an hour to several hours, are observed.
3. Synchronous variations of equivalent widths in the emission
and absorption spectrum and of the star's ![]() -band brightness
were observed at least during one 6-year cycle.
-band brightness
were observed at least during one 6-year cycle.
4. A complex relation between emission in hydrogen as well as H and K яЮII lines and the emission veiling absorption lines of metals is observed. At low and intermediate strengths of the emission spectrum, the absorption spectrum varies independently. During the high level of the emission spectrum, the absorption spectrum also becomes stronger.
References:
Alencar, S.H.P., Batalha, C., 2002, Astrophys. J., 571, 378
Basri, G., Batalha, C., 1990, Astrophys. J., 363, 654
Collier Cameron, A., Campbell, C.G., 1993, Astron. and Astrophys., 274, 309
Ghosh, P., Lamb, F.K., 1979, Astrophys. J., 232, 259
Herbig, G.H., 1977, Astrophys. J., 214, 747
Ismailov, N.Z., Guliev, N.Kh., Alieva, A.A., 2006, Perem. Zvezdy, 26, No. 3
Ismailov, N.Z., Samus, N.N., 2003, Inform. Bull. Var. Stars, No. 5382
Königl, A., 1991, Astrophys. J., 370, L39
Lamzin, S.A., 1995, Astron. and Astrophys., 295, L20
Melnikov, S.Yu., Grankin, K.N., 2005, Astronomy Letters, 31, 109
Rustamov, B.N., 1987, Kinematika i Fizika Nebesnykh Tel, 3, 15
Rustamov, B.N., 1999, Shamakha Obs. Circular, No. 97, 14
Shu, F.H., Najita, J., Ostriker, E. et al., 1994, Astrophys. J., 429, 781