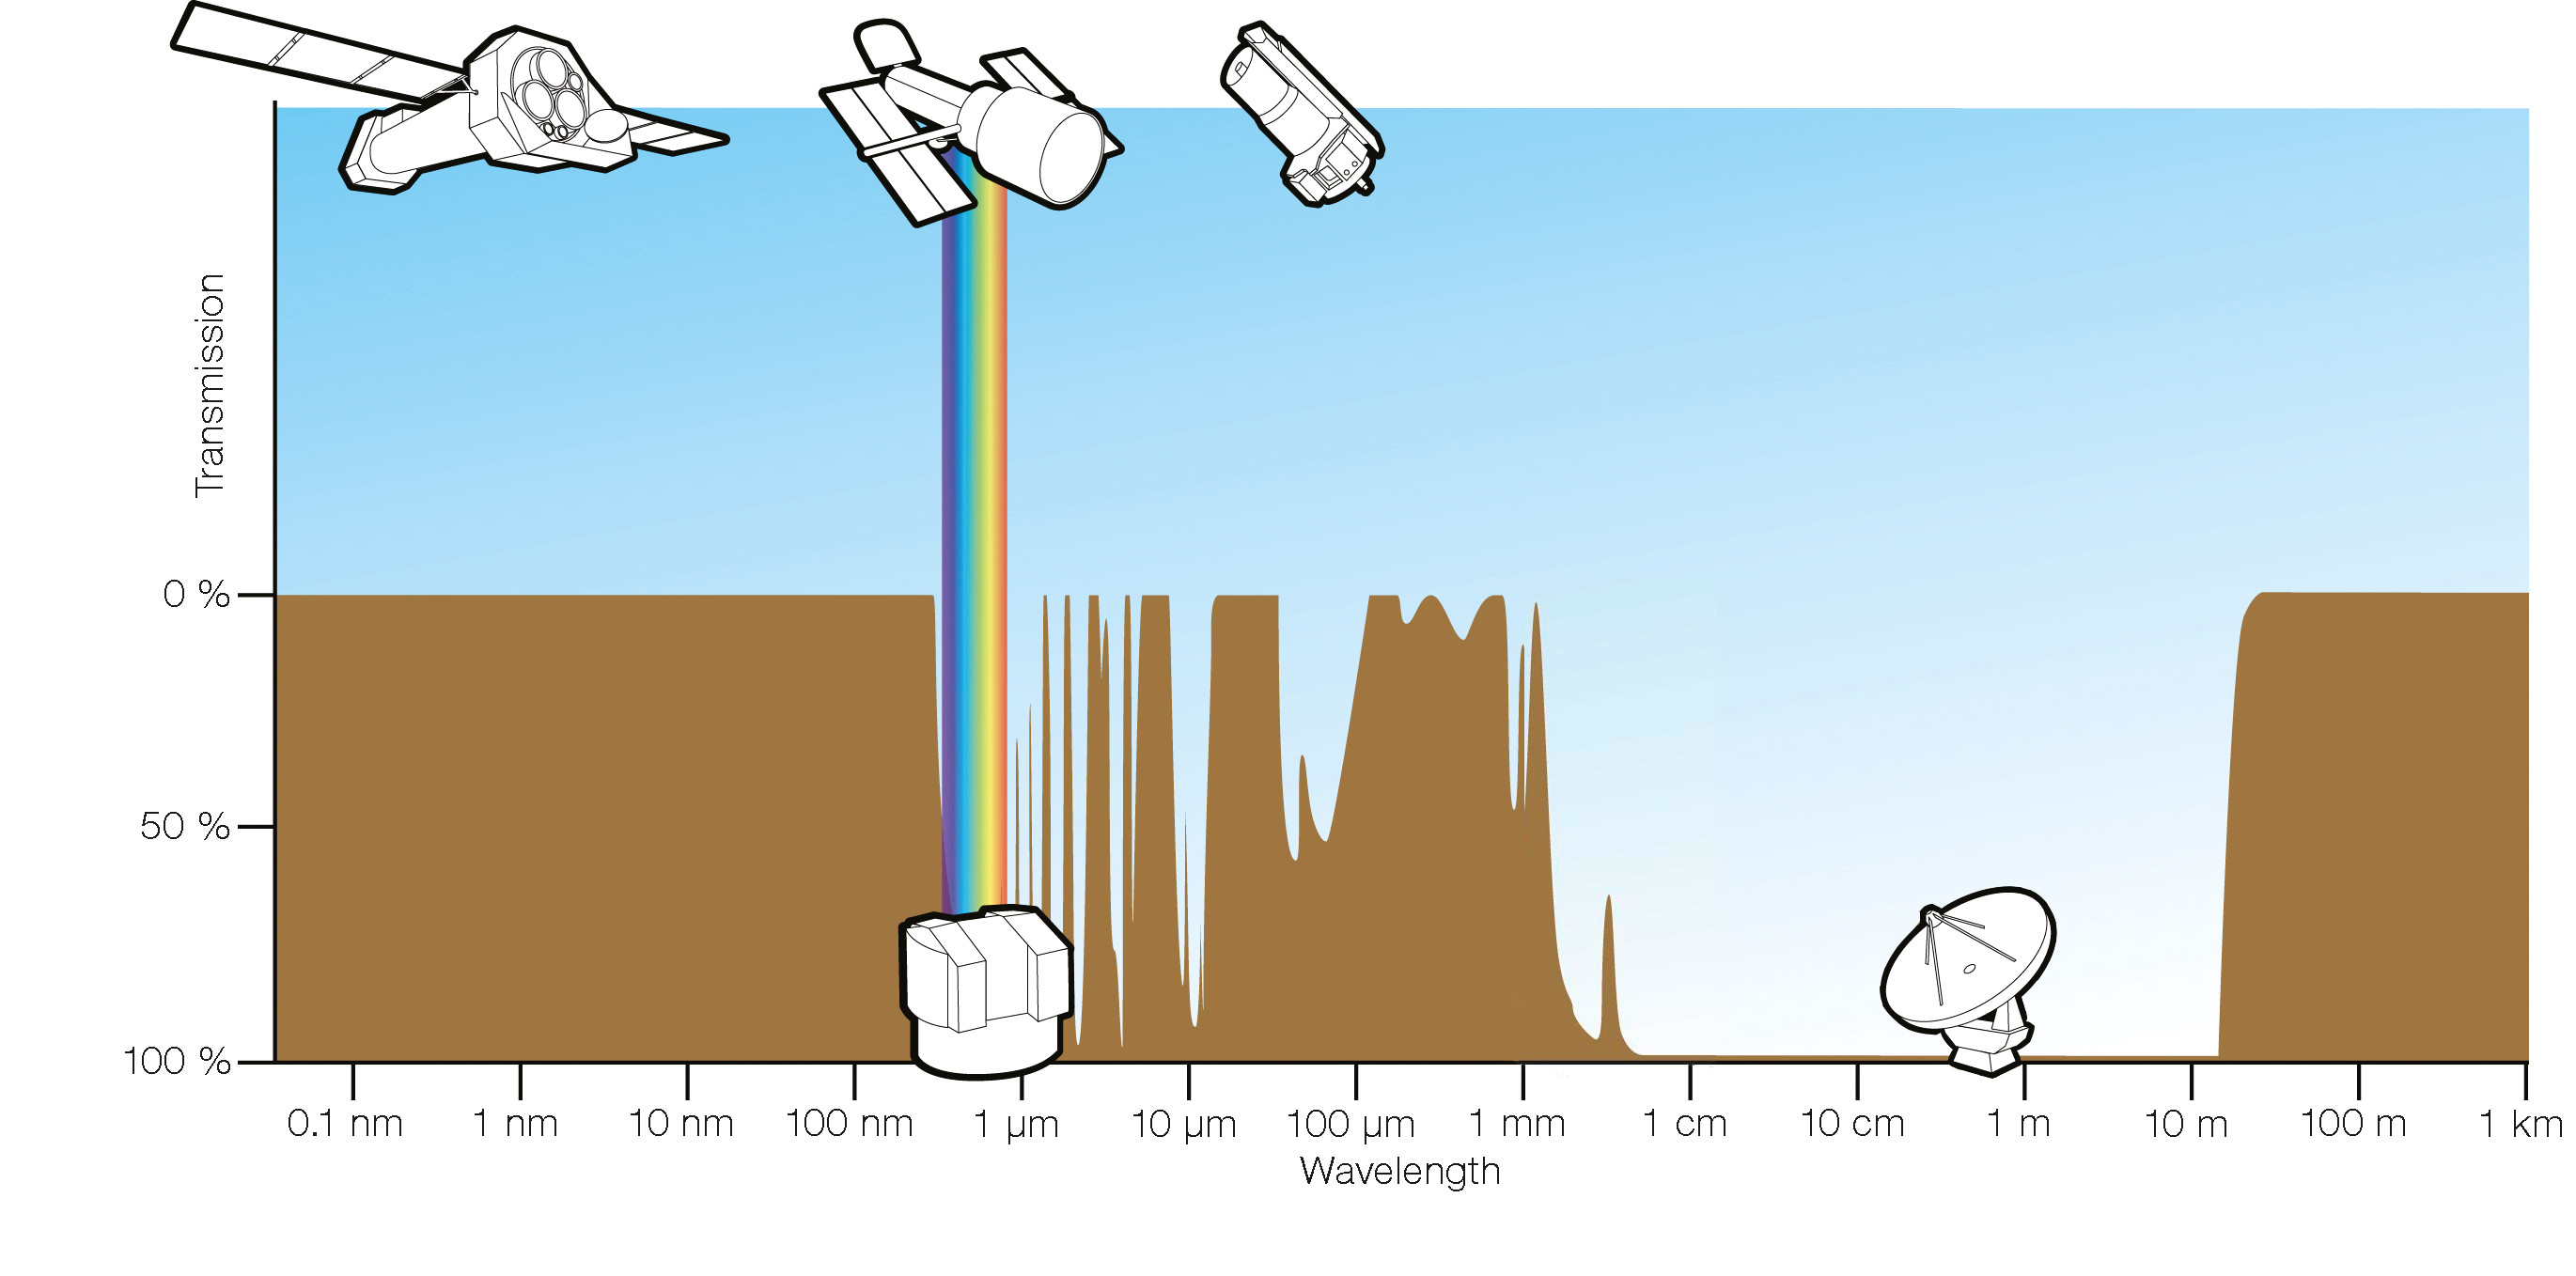
Atmospheric opacity graph

Graph of atmospheric opacity as a function of wavelength
In this graph, the level of the brown curve represents how opaque the atmosphere is at the given wavelength. The major windows are at visible wavelengths (marked by the rainbow) and at radio wavelengths from about 1 mm to 10 m. ALMA operates in a borderline region, where the opacity depends strongly on how high and dry the site is.
Credit:€аESA/Hubble (F. Granato)
